
Most homes have a few appliances quietly chewing through electricity every day. You see the total on your bill, but not which devices are driving it up. That’s where smart energy monitors come in.
By learning how to use smart energy monitor data, you can turn vague guesses into clear numbers. Instead of wondering whether it’s the fridge, the gaming PC, or the space heater, you’ll know exactly which devices are your top power hogs and how much they cost you each month.
This guide walks you through the basics, from choosing and setting up a monitor to using the data to find your five biggest energy wasters and turn that knowledge into real savings.
Why Your Home Has Hidden Power Hogs (and How Smart Monitors Expose Them)
The problem with guessing which appliances use the most energy
Most people assume the devices they use the most are the ones using the most energy. That’s not always true. Some appliances draw a lot of power in short bursts, while others sip energy all day and night.
Common guessing mistakes include:
- Underestimating always-on devices like networking gear, cable boxes, and older fridges.
- Overestimating short-use devices like microwaves or hair dryers.
- Ignoring standby power from TVs, game consoles, and chargers that are “off” but still plugged in.
- Forgetting about seasonal equipment like dehumidifiers, space heaters, or window AC units.
Without data, you might unplug the wrong things, focus on low-impact habits, and leave the real power hogs untouched.
How smart energy monitors turn invisible usage into clear data
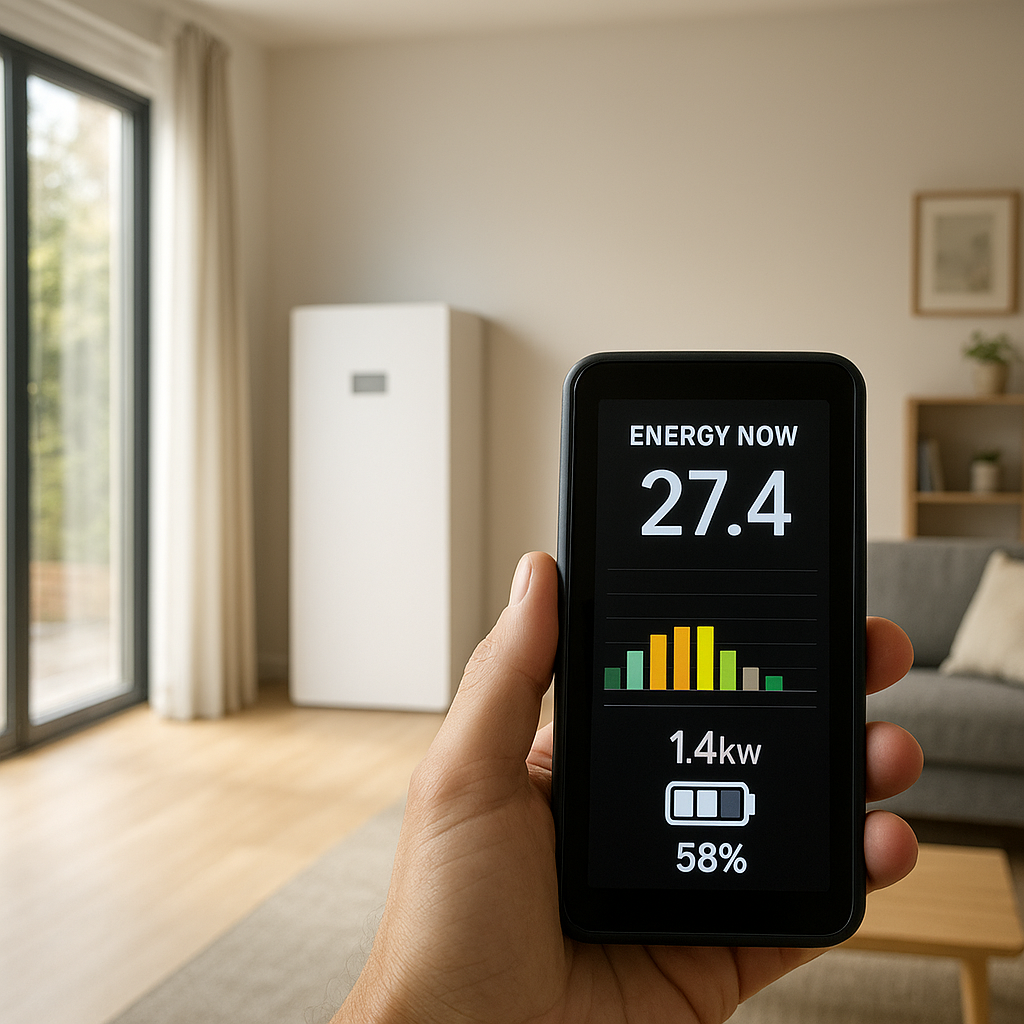
Smart energy monitors measure how much electricity your home or specific devices use and send that data to an app. Instead of a single number on your bill once a month, you get:
- Real-time power draw in watts for your whole home or a single outlet.
- Historical usage in kilowatt-hours (kWh) per hour, day, week, or month.
- Cost estimates based on your local electricity rate.
- Sometimes, automatic detection of individual appliances based on their usage patterns.
That data lets you see spikes when certain devices turn on, track always-on loads, and compare different appliances directly. The result: you can confidently list your five biggest power hogs and decide what to do about each one.
Understanding Smart Energy Monitor Data Basics
Key metrics explained: watts, kWh, amps, voltage, and cost per kWh
To make sense of the graphs in your app, you only need a few core terms:
- Watts (W): The rate of power use at a given moment. Think of this as the “speedometer” for electricity. A 1,500 W space heater uses much more power than a 60 W laptop charger.
- Kilowatt-hours (kWh): Energy used over time. Your utility charges you for kWh, not watts. A 1,000 W (1 kW) device running for 1 hour uses 1 kWh.
- Amps (A): The amount of electrical current flowing. Most homeowners can focus on watts and kWh, as monitors calculate amps from those values.
- Voltage (V): The electrical “pressure.” In North America, typical household voltage is about 120 V; larger appliances like ovens and dryers may use 240 V.
- Cost per kWh: The price you pay your utility for each kWh. Your monitor uses this to estimate cost. You’ll find this number on your electric bill.
When you know your cost per kWh, you can take any device’s kWh usage from the app and quickly translate it into real dollars.
Real-time vs historical data: when to use each view
Smart energy apps usually give you both live and historical data. Each is useful for different tasks:
- Real-time data: Best for experiments. Turn a device on or off and watch the wattage jump. This is how you identify what’s causing immediate spikes.
- Historical data: Best for spotting patterns. Look at daily or weekly kWh to see which devices quietly add up, and whether changes you made are paying off.
Use real-time views when doing “on/off” testing, and historical views when ranking your devices or comparing this month to last month.
Whole-home vs plug-in (socket) energy monitors
There are two main types of smart energy monitors:
- Whole-home monitors: Typically installed in your electrical panel (for example, Sense, Emporia Vue). They measure total home usage and sometimes use machine learning to identify individual appliances.
- Plug-in or smart plug monitors: These plug into a wall outlet, and your device plugs into them (examples include TP-Link Kasa smart plugs with energy monitoring, or Eve Energy for HomeKit).
Whole-home monitors are best for a complete picture and catching big, hard-wired loads like central AC, electric furnaces, or tank water heaters. Plug-in monitors are ideal for easily moved devices like TVs, space heaters, dehumidifiers, or gaming PCs.
For most households, a combination of one whole-home monitor plus a few smart plugs gives the best balance of coverage and cost.
Step-by-Step: Setting Up Your Smart Energy Monitor for Accurate Data
Choosing the right type of monitor for your home and budget
Before you start, decide what level of detail and investment makes sense:
- Budget approach: A few smart plugs with energy monitoring. Good for renters or those mainly worried about plug-in devices.
- Mid-range setup: One whole-home monitor plus 2–4 smart plugs for key circuits or appliances. Great for most homeowners.
- Premium setup: Advanced whole-home monitor with dedicated circuit clamps (for EV chargers, HVAC, etc.) plus many smart plugs. Best if you want very detailed tracking or have high usage.
Check your home’s electrical panel type, Wi‑Fi coverage near the panel, and whether you’re comfortable hiring an electrician if needed.
Installation checklist and safety tips (panel-based vs plug-based)
For panel-based whole-home monitors:
- Turn off the main breaker before opening the panel.
- Follow the manufacturer’s installation guide precisely.
- Attach current transformers (CT clamps) to the correct mains or circuits.
- Route monitor cables safely and close the panel securely.
- If you’re not experienced or comfortable with electrical work, hire a licensed electrician.
Many manufacturers strongly recommend professional installation. For a deeper understanding of how residential electrical panels work, this overview of electric power distribution can be helpful context.
For plug-based monitors and smart plugs:
- Plug the smart plug into a standard wall outlet.
- Ensure the appliance you connect doesn’t exceed the plug’s rated current (usually 10–15 A).
- Avoid daisy-chaining power strips or high-power space heaters through low-rated smart plugs.
- Place Wi‑Fi routers or extenders so the plug has a reliable signal.
Connecting to Wi‑Fi, pairing with the app, and setting your energy rate
Once installed physically, you’ll:
- Download the manufacturer’s app on your phone or tablet.
- Create an account and follow the pairing steps (usually involves pressing a button on the device).
- Connect the monitor to your 2.4 GHz Wi‑Fi network if required.
- Enter your electricity rate (cost per kWh) from your bill. Some monitors let you add peak/off-peak rates.
Setting the correct rate is crucial. Without it, cost estimates will be wrong and it will be harder to prioritize which power hogs to tackle first.
Calibrating and verifying that your readings are trustworthy
To gain confidence in your data:
- Compare your monitor’s daily or weekly kWh total with the reading from your utility meter over the same period.
- Turn on a known device (for example, a 1,500 W space heater) and check that the reported wattage is roughly correct.
- Ensure time zones and units in the app settings are correct.
- Let a whole-home monitor run for a few days before drawing strong conclusions, especially for devices that cycle on and off like fridges or HVAC systems.
Method 1: Using Whole-Home Smart Monitor Data to Spot Big Power Hogs
Reading the live power graph to catch major spikes
Open your monitor’s live view and watch the total wattage. Then, try this:
- Turn your central AC or electric furnace on and off and note the change in watts.
- Start the oven, dryer, or dishwasher and watch the spike.
- Turn off as many things as possible (lights, TVs, PCs) and note your “baseline” load.
Devices that cause big jumps—often 1,000–4,000 W—are almost always among your top power hogs, especially if they run frequently.
Using appliance detection and labels (if your monitor supports it)
Some whole-home monitors offer automatic appliance detection. Over time, they recognize patterns like the compressor cycle of your fridge or the heating element of your oven.
To make this feature more useful:
- Label detected devices as the app suggests them (e.g., “Upstairs AC,” “Garage fridge”).
- Merge or rename devices if you see duplicates or confusing labels.
- Review each device’s weekly or monthly kWh to see which ones dominate.
If your monitor struggles to detect a specific appliance, you can still track it using controlled tests and smart plugs.
Running controlled tests: switching devices on/off and logging changes
Controlled tests are a simple way to map spikes to devices:
- Pick a room or category (for example, “living room entertainment”).
- Turn everything in that category off.
- Turn devices back on one at a time and record how much the wattage increases.
- Write the results in a notebook or spreadsheet.
Repeat this for major categories: heating and cooling, water heating, kitchen, entertainment, and office. You’ll quickly see which devices cause the largest sustained increases.
Identifying always-on loads that quietly drain power 24/7
Always-on loads don’t cause big spikes, but they run constantly and add up:
- Look at your lowest power draw during the night or when you’re away. That’s your “always-on” baseline.
- Subtract known big loads (like a fridge or network gear) if possible.
- Use smart plugs to isolate and measure specific always-on devices like cable boxes, routers, and smart speakers.
Even a 50 W always-on load uses about 36 kWh per month. At $0.20/kWh, that’s over $7/month for a single device that might be doing nothing useful most of the day.
Method 2: Using Smart Plugs and Outlet Monitors for Individual Devices
Which appliances to plug into smart outlets first
Start with plug-in devices that either run a lot or are known power users:
- Space heaters and portable AC units.
- Gaming PCs and high-end laptops.
- Large TVs and sound systems.
- Dehumidifiers, air purifiers, and portable fans.
- Old refrigerators or freezers in garages and basements.
You can later expand to other devices if you suspect they’re using more than expected.
Tracking daily and weekly kWh per device in the app
Most smart plugs with energy monitoring let you see usage per day, week, and month. To use this data well:
- Let each plug run for at least a full week under normal usage.
- Write down each device’s weekly kWh and estimated cost.
- Note whether the device is essential (fridge) or optional (extra TV, decorative lighting).
Devices with both high kWh and optional usage are your best candidates for changes or automation.
Comparing similar devices (TV vs TV, fridge vs fridge) to spot outliers
Smart plugs make it easy to compare similar devices and find the odd one out. For example:
- Two similar-sized TVs where one uses double the energy due to brightness settings or an older panel.
- An older garage fridge that uses far more kWh than your newer kitchen model.
- Two gaming PCs, one left on 24/7 and another set to sleep aggressively.
Once you find an outlier, you can tweak settings, adjust how you use it, or replace it altogether.
Creating a simple spreadsheet or notes log to rank usage
A basic log helps you turn scattered readings into a clear top-five list:
- Create columns for Device, Location, Weekly kWh, Monthly cost estimate, and Notes.
- Fill in data from both your whole-home monitor and smart plugs.
- Sort by Weekly kWh or Monthly cost to see your biggest power hogs at a glance.
This simple step makes it much easier to decide where to focus your efforts.
The 5 Biggest Power Hogs You’re Most Likely to Find
Heating and cooling: space heaters, AC units, and electric furnaces
Heating and cooling are usually the largest energy users in a home. In your data, look for:
- Window or portable AC units that draw 800–1,500 W or more when running.
- Space heaters routinely running at 1,500 W.
- Electric furnaces or heat strips causing large spikes when the thermostat calls for heat.
Even small changes—like lowering heating setpoints a degree or two, or using a smart thermostat—can make a noticeable difference in your total kWh.
Water heating: electric water heaters, recirculation pumps, and hot tubs
Electric water heaters can easily become top power hogs, especially older models with poor insulation. Watch for:
- Tank water heaters cycling on and off throughout the day.
- Hot water recirculation pumps running constantly instead of on a timer.
- Hot tubs or spas maintaining temperature around the clock.
If you want a technical overview, the U.S. Department of Energy’s guide on water heating technologies explains why these systems can be so energy intensive.
Kitchen culprits: old refrigerators, freezers, and always-on appliances
In many homes, the kitchen hides several steady energy users:
- Older fridges and freezers that run inefficient compressors almost nonstop.
- Wine coolers and beverage fridges.
- Always-on appliances like smart ovens with displays, under-cabinet lighting, or plug-in coffee makers with warming plates.
Monitor each fridge or freezer for at least a few days to see if it belongs in your top five.
Entertainment and office: gaming PCs, large TVs, and networking gear
Modern entertainment setups can rival major appliances in energy use:
- Gaming PCs pulling 300–600 W while in use, plus idle draw if left on.
- Large OLED/QLED TVs using 150–400 W at high brightness.
- Soundbars, AV receivers, and subwoofers adding to the total.
- Home office gear like desktop PCs, monitors, and laser printers.
Smart plugs make it easy to understand exactly how much your living room or office costs to run each month.
Always-on background loads: routers, chargers, and standby electronics
Finally, your always-on background loads may not draw much individually, but together they can be one of your top five categories:
- Wi‑Fi routers, mesh nodes, and modems.
- Cable boxes and streaming boxes that never fully power off.
- Game consoles in “instant-on” or standby mode.
- Chargers and small power bricks left plugged in.
You don’t need to unplug everything, but your data will highlight the standbys that are worth tackling.
Turning Data into Savings: What to Do Once You Find the Power Hogs
Quick wins: smart schedules, timers, and automation rules
Once you know your top five power hogs, target them with simple automations:
- Use smart plugs to turn off TVs, consoles, and office gear at night.
- Schedule dehumidifiers or air purifiers to run only during specific hours.
- Use motion sensors or occupancy detection to shut off fans or lights in empty rooms.
These changes can often be set up in minutes but pay off every month.
Adjusting thermostat and water heater settings based on your data
Your smart energy data will show the impact of even small setting changes:
- Lower your heating setpoint by 1–2°F or raise your cooling setpoint slightly and watch HVAC kWh drop over the next week.
- Set water heaters to a reasonable temperature (often 120°F is enough for most homes; check local guidance and safety considerations).
- Use scheduling features on smart thermostats and water heaters to avoid heating or cooling when nobody is home.
When it’s worth replacing an appliance vs changing usage habits
Compare the cost of replacement to the ongoing cost of running a power hog:
- If an old fridge costs $20–$30/month in electricity, a newer efficient model might pay for itself in a few years.
- If a gaming PC is the main issue, better power settings or a low-power secondary device for casual use may be enough.
- If a hot tub dominates your bill, using a cover consistently and adjusting temperature can help without needing replacement.
Let the numbers guide you instead of guessing.
Calculating simple payback: how long upgrades take to pay for themselves
To estimate payback time for an upgrade:
- Find the device’s current monthly cost from your monitor.
- Estimate the new device’s monthly cost using manufacturer specs or typical usage tables.
- Subtract to find your monthly savings.
- Divide the purchase price by monthly savings to get months to payback.
If a $600 appliance saves $15/month, payback is about 40 months (a little over 3 years). That kind of simple math can make buying decisions much easier.
Automating Energy Savings with Your Smart Home System
Using smart plugs to cut standby power at night automatically
Smart plugs are ideal for eliminating overnight standby power:
- Create schedules that cut power to entertainment centers, office gear, or hobby equipment during typical sleep hours.
- Use “away” modes that turn off non-essential devices when nobody is home.
- Tag plugs by room or zone so you can manage groups easily.
Your energy monitor data will then show a clear drop in nighttime baseline usage.
Linking smart thermostats and sensors to occupancy and time-of-day
Integrate your smart thermostat with motion sensors, door sensors, or presence detection from your smart home platform:
- Reduce heating or cooling automatically when the house is unoccupied.
- Use preheating or precooling just before you typically arrive home.
- Adjust setpoints at night for better efficiency and comfort.
Over time, you’ll see your HVAC share of total home kWh shrink, even if comfort improves.
Creating scenes and routines that optimize comfort and cost
Use your smart home app (Alexa, Google Home, HomeKit, or a hub like SmartThings or Home Assistant) to build scenes that balance comfort and efficiency, such as:
- “Movie Night” that dims lights but avoids unnecessary heating from extra lamps.
- “Workday” that powers on only essential office gear and keeps everything else off.
- “Vacation” that minimizes always-on loads while maintaining security systems and critical appliances.
Check your energy monitor after a week or two of using these scenes to see how much they changed your average daily usage.
Tracking Progress: How to Measure Your Energy Savings Over Time
Comparing monthly usage and costs in your energy monitor app
Most apps let you compare current usage against previous periods. To track progress:
- Record your total kWh and cost for a baseline month before major changes.
- After making adjustments, compare month-over-month graphs.
- Pay attention to total kWh, not just the bill amount, since rates can change.
This long-term view shows whether your changes are making a lasting difference.
Setting alerts for unusual spikes or always-on increases
Some monitors let you set alerts when:
- Power usage spikes above a certain threshold.
- Always-on usage creeps higher over time (for example, after adding new electronics).
- Daily kWh exceeds a target you’ve set.
These alerts can warn you about failing appliances, accidentally left-on heaters, or new devices that use more energy than expected.
Seasonal checks: re-running your power hog audit each quarter
Your top power hogs will change with the seasons. Aim to repeat a simplified audit every few months:
- Spring: Focus on dehumidifiers, fans, and shoulder-season heating.
- Summer: Check AC units, fridges, and freezers.
- Fall: Look at heaters, lighting as days get shorter, and entertainment devices.
- Winter: Revisit heating, always-on loads, and holiday lighting.
Use whole-home data plus smart plug readings to update your top-five list as your habits change.
Common Mistakes When Using Smart Energy Monitor Data (and How to Avoid Them)
Misreading short spikes vs sustained loads
Not every spike matters. A microwave that pulls 1,200 W for 2 minutes a day won’t add much to your bill, even though it looks dramatic in real-time graphs.
Focus on sustained loads and total kWh over time, not just peak watts.
Forgetting to set or update your electricity rate
If you don’t input the correct cost per kWh, your savings estimates will be off. Revisit your settings when:
- Your utility raises rates.
- You switch to a time-of-use or tiered plan.
- You move to a new region.
Accurate rates make it much easier to prioritize the most expensive devices.
Ignoring always-on loads because they seem “too small”
A 20 W standby load might not sound like much, but over a year it can use more than 175 kWh. Multiply that by several devices and it’s a meaningful chunk of your bill.
Don’t overlook your baseline usage. Reducing always-on loads often requires just a few smart plugs or better power settings.
Buying Guide: Recommended Smart Energy Monitors and Smart Plugs
Features to look for: app quality, detection accuracy, integrations
When choosing a smart energy monitor or smart plug, pay attention to:
- App usability: Clear graphs, easy device labeling, and reliable notifications.
- Data resolution: How often readings update and how far back you can view history.
- Appliance detection (for whole-home monitors): Accuracy and how easy it is to train or correct.
- Smart home integrations: Works with your preferred platform for automation.
- Privacy and cloud requirements: Whether data is stored locally or in the cloud.
Choosing between budget, mid-range, and premium options
Your best option depends on how deep you want to go:
- Budget: A few energy-monitoring smart plugs give you quick insight into the worst offenders.
- Mid-range: A whole-home monitor with basic appliance detection and a handful of smart plugs offers a good balance.
- Premium: Advanced whole-home systems with individual circuit monitoring are ideal for large homes, EVs, or people who love detailed data.
Start small if you’re unsure. You can always expand once you see how valuable the data is.
Ensuring compatibility with Alexa, Google Home, and HomeKit
To automate savings, make sure your devices play nicely with your voice assistant or hub:
- Check for “Works with Alexa,” “Google Home compatible,” or “Apple HomeKit” badges.
- Confirm whether energy readings can trigger automations (for instance, turning off a plug if it exceeds a certain wattage).
- Look for support articles or user forums showing real-world integrations similar to what you want to build.
Final Checklist: Your 1-Week Plan to Find the 5 Biggest Power Hogs
Day-by-day actions to set up, test, and rank your top energy wasters
Use this simple one-week plan to go from zero data to a clear top-five list:
- Day 1: Install your whole-home monitor (or plug-based monitors), connect to Wi‑Fi, and enter your electricity rate.
- Day 2: Run basic live tests—turn major appliances on/off and note the wattage changes.
- Day 3: Plug smart outlets into suspected power hogs (space heaters, gaming PCs, extra fridges). Start logging daily kWh.
- Day 4: Identify your always-on baseline by checking usage late at night or when you’re away.
- Day 5: Compare devices using the app’s weekly kWh data and your notes. Begin a simple spreadsheet ranking.
- Day 6: Set up key automations: smart plug schedules, thermostat tweaks, and standby cutoffs.
- Day 7: Finalize your top five power hog list and estimate monthly costs. Decide where to change habits, automate, or plan replacements.
How to turn your findings into a long-term low-energy routine
Once you’ve found your power hogs and taken initial action:
- Review your energy app weekly at first, then monthly as things stabilize.
- Adjust automations as your schedule and seasons change.
- Re-test after any major purchase or new appliance installation.
- Keep your spreadsheet or log updated so you can see improvements over time.
By treating your smart energy monitor as a permanent tool, not a one-time project, you can keep bills lower and spot waste early—without sacrificing comfort.
FAQ
Do I need both a whole-home monitor and smart plugs?
No, but using both together gives the clearest picture. A whole-home monitor shows where your total energy is going, while smart plugs let you zoom in on specific devices. Many people start with smart plugs and add a whole-home monitor later.
How accurate are smart energy monitors?
Most reputable monitors are accurate enough for home use, typically within a few percent. You can verify accuracy by comparing daily kWh totals with your utility meter. For finding your biggest power hogs and making decisions about habits or upgrades, this level of accuracy is more than sufficient.
Will using smart plugs and monitors increase my energy usage?
Smart plugs and monitors use a small amount of power themselves, usually just a few watts. The savings they enable by helping you identify and control waste almost always outweigh their own usage by a wide margin.
How long should I monitor a device before deciding if it’s a power hog?
For devices that run daily, a week of normal use is usually enough to see their impact. For seasonal or occasional devices, monitor during the period when you use them the most—such as during a heat wave for AC units or cold spells for space heaters.
Can renters use smart energy monitor data effectively?
Yes. Renters can focus on plug-in devices by using smart plugs and portable monitors that don’t require panel access. You won’t see hard-wired loads like central HVAC as clearly, but you can still find and fix many of your top five power hogs among entertainment, office, and kitchen appliances.