Your smart energy monitor can be more than a cool graph on your phone. Used well, it can become a step‑by‑step guide to shrinking your energy bills without sacrificing comfort.
This guide walks you through how to use smart energy monitor data over your first 30 days. You’ll learn how to read the charts, spot waste, and turn what you see in the app into five practical, easy wins for your home.
The advice here applies to whole‑home monitors like Sense, Emporia, Wiser, and Neurio, as well as utility smart meter apps and some advanced smart plugs and power strips.
Why Your Smart Energy Monitor Is the Fastest Path to Lower Bills
What a smart energy monitor actually measures (and what it doesn’t)
A smart energy monitor measures how much electricity your home is using, usually in real time. At the simplest level, it tracks:
- Power (W or kW) – how much power you’re using right now.
- Energy (kWh) – how much energy you used over time (hour, day, month).
- Cost – your usage multiplied by your electricity rate.
Whole‑home monitors are typically installed in your electrical panel and watch all circuits at once. Some models combine this with plug‑in smart plugs or circuit‑level sensors to show appliance‑specific data.
Some monitors try to automatically identify devices by their “signature” (for example, the distinct way a fridge or microwave turns on). This can be helpful, but it isn’t perfect. To understand what these devices generally can and can’t do, you can read more about home energy monitors here: Home energy monitor overview.
What your monitor does not measure directly:
- Gas usage (furnaces, gas water heaters) – it may see the electricity used by blowers or controls, but not the gas itself.
- Water usage – unless you have a separate water monitor.
- Comfort levels – it can’t tell if you’re too hot or cold, only how much power your HVAC is using.
Think of it as a very detailed electric bill that updates every few seconds instead of once a month.
Why the first 30 days of data are the most valuable
Your first month gives you a baseline and reveals your biggest opportunities. During this period you can:
- See your typical daily pattern: waking up, work hours, evening, sleep.
- Spot always‑on loads that never drop, even at night.
- See how heating, cooling, and water heating behave over different days.
- Identify one‑time anomalies (like a space heater left on) vs recurring waste.
Once you act on these early insights, you can compare week 1 to week 4 and clearly see if you’re actually saving energy.
Common mistakes people make when they ignore their data
Many homeowners install a monitor, open the app a few times, and then forget about it. Common missed opportunities include:
- Ignoring always‑on usage – leaving hundreds of watts running 24/7 in idle devices.
- Not connecting devices – never pairing smart plugs or thermostats that could automate savings.
- Looking only at monthly summaries – missing the hourly and daily patterns that show what to fix.
- Chasing tiny wins first – focusing on LED bulbs while a pool pump runs inefficiently for hours.
This guide is designed to help you avoid those traps and put your data to work immediately.
Getting Set Up: Make Sure Your Smart Energy Monitor Data Is Accurate
Check that your monitor is installed and paired correctly
Before you trust the graphs, make sure the hardware and app are set up properly:
- Confirm the monitor is installed on the correct mains or circuits (usually done by an electrician).
- Verify that voltage and service type (single‑phase vs split‑phase) are set correctly in the app.
- Check that your Wi‑Fi or hub connection is stable and the monitor shows as “online”.
- Compare today’s usage in the app with your utility meter reading or your last bill to see if it’s in the same ballpark.
If something looks wildly off, fix that first. All of your insights depend on reasonably accurate readings.
Set your home profile: occupants, schedules, tariffs, and appliances
Most energy monitor apps include a home or account profile. Spending five minutes here pays off later:
- Occupants and schedules – who is home during the day, typical bedtimes, work‑from‑home patterns.
- Tariffs and time‑of‑use rates – add your peak/off‑peak prices, weekend vs weekday rates, and fixed charges if your app supports them.
- Appliance list – note big loads like electric water heaters, dryers, ovens, EV chargers, pool pumps, and mini‑splits.
This context helps the app calculate costs more accurately and improves device detection in systems that attempt to identify individual appliances.
Enable key app features: real-time view, historical data, and alerts
Look through your app settings and make sure these features are enabled or easy to access:
- Real‑time or live view – shows instant power usage so you can turn things on/off and see the impact right away.
- Daily/weekly/monthly history – charts that let you scroll back and compare days and weeks.
- Alerts and notifications – high usage alerts, unusual activity, or device‑specific alerts if available.
Having these ready from day one makes your 30‑day action plan much smoother.
How to Read Smart Energy Monitor Data Without Getting Overwhelmed
Understanding the main dashboard: kWh, cost, and power (W) in plain English
Your main dashboard usually has three key numbers:
- Power (W or kW): Your current speed of energy use. High power for a short time can still be low total energy.
- Energy (kWh): Total usage over a period. This is what your utility bills you for.
- Cost: Your usage multiplied by your tariff, sometimes broken down by time‑of‑use.
To keep things simple early on, check:
- Your current power a few times per day (morning, mid‑day, evening, night).
- Your daily kWh total at the end of each day.
- Your estimated bill once per week to see if you’re trending up or down.
Daily vs hourly views: when to use each and what to look for
Switching between daily and hourly views helps you answer different questions:
- Daily view: Best for spotting which days are expensive. Look for weekends vs weekdays, or specific days with much higher usage.
- Hourly view: Best for seeing patterns. Look at when your usage peaks and how low it drops overnight.
Key things to look for:
- Does your usage ever drop to a low baseline at night?
- Are there sharp spikes linked to cooking, laundry, or hot water?
- Do some devices appear to run much longer than expected?
Week-over-week comparison: spotting patterns instead of one-off spikes
Most apps let you compare this week to last week. Use this to see:
- If your changes (new schedules, thermostat tweaks) are actually lowering kWh.
- Whether high‑usage days repeat on a schedule (for example, every laundry day).
- How weather affects your cooling and heating loads from week to week.
Don’t panic over one strange day. Instead, watch for repeated patterns you can change with habits or automation.
Using appliance-level data (if available) vs whole-home signatures
If you have smart plugs (like TP‑Link Kasa, Eve Energy, or Emporia smart plugs) or circuit‑level monitoring, your app may show per‑appliance data. This makes it easy to see:
- Exactly how much your fridge, TV, or gaming setup uses per day.
- Which devices are always on vs truly off at night.
- The real cost of “fun” devices like projectors or sound systems.
If you only have whole‑home data, you’ll rely more on “signatures” — patterns in the graph. For example:
- A short, tall spike when you use the microwave.
- Regular cycles from your fridge or heat pump.
- Long plateaus when a space heater or window AC is left on.
Either way, you can still find the five easy wins in this guide.
Easy Win #1 (Days 1–7): Kill Always-On Vampire Loads
How to use baseline (night-time) usage to find always-on power
Start by checking your home’s power usage between roughly midnight and 5 a.m. on a typical night:
- If your overnight power draw is under ~150–250 W for a small home, that’s reasonable.
- If it sits at 300–600 W or more, you likely have vampire loads.
Switch to hourly view and look for long, flat sections. That’s your baseline — everything that’s never turned off. Your goal this week is to see how far you can safely push that line down.
Identifying hidden culprits: routers, TVs, set-top boxes, chargers, and consoles
Many electronics draw power even when they seem “off”:
- Routers and modems.
- TVs and soundbars in standby.
- Set‑top boxes and streaming devices.
- Game consoles in rest mode.
- Old phone and laptop chargers left plugged in.
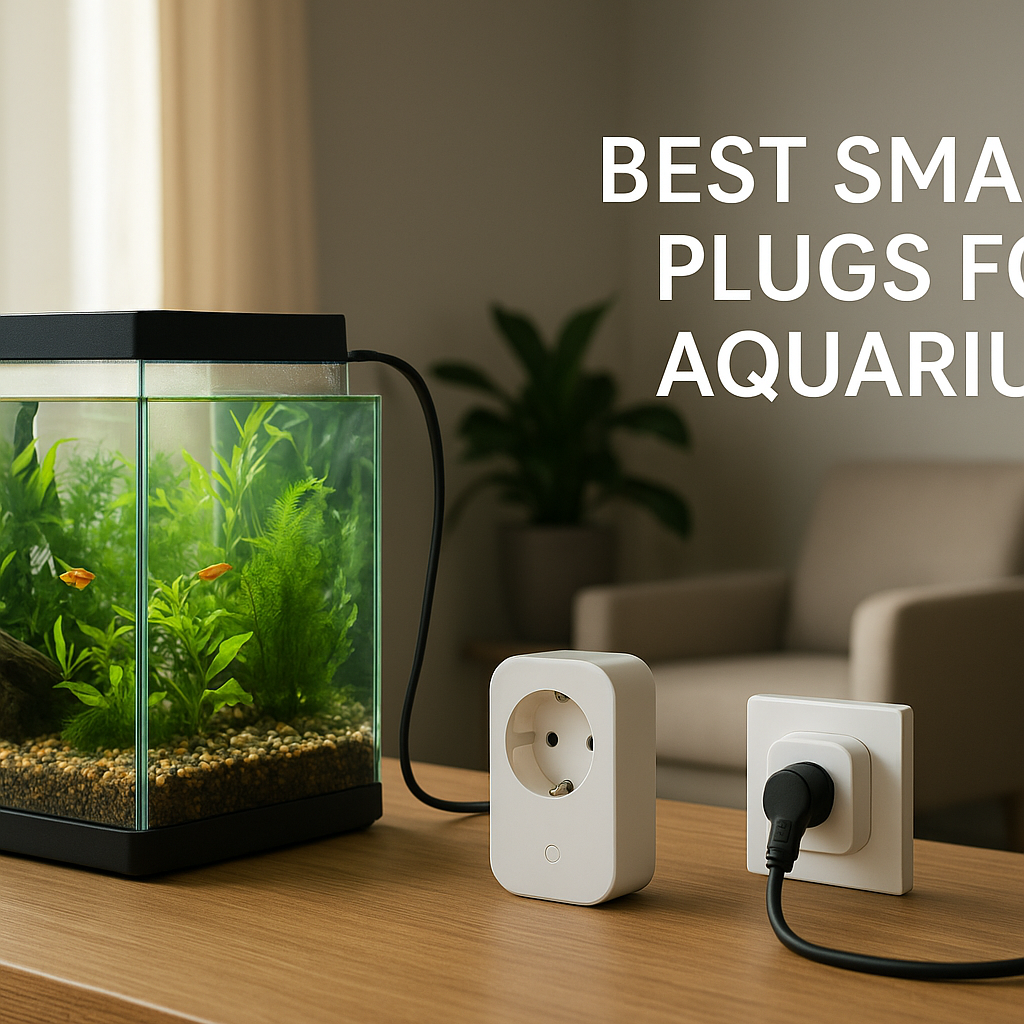
- Fish tank heaters and pumps.
To find specific culprits, use your live power view. Unplug or switch off one suspect device at a time and watch for a drop in watts.
Quick actions: smart plugs, power strips, and schedules to cut idle loads
Once you’ve found unnecessary always‑on loads:
- Put entertainment centers on smart power strips or smart plugs and schedule full shutdown at night.
- Use smart plugs on game consoles, 3D printers, and office equipment so they’re only powered when needed.
- Create a “Goodnight” scene on your smart assistant (Alexa, Google Home, or Apple Home) that powers down non‑essential plugs.
Watch your overnight baseline over several days. You should see a clear step down after these changes.
Easy Win #2 (Days 4–10): Tame Heating and Cooling Spikes
Reading your data during HVAC cycles: what a normal pattern looks like
Heating and cooling often make up the largest share of your bill. In your energy graph, HVAC usually appears as:
- Large, repeating blocks of high power, often 1–4 kW at a time.
- Regular cycles where power ramps up, stays high for 10–30 minutes, then drops.
Check an especially hot or cold day. Mark when your thermostat is set to run and confirm that the spikes match.
Spotting inefficient behavior: frequent cycling, long run times, or odd hours
Look for patterns that suggest waste:
- Short, frequent cycles – the HVAC turns on and off every few minutes. This can indicate poor settings, an oversized system, or thermostat placement issues.
- Very long run times – it runs almost continuously during moderate weather.
- Odd hour operation – heavy usage when the home is empty or overnight when a setback schedule should reduce demand.
Write down two or three clear issues you see in the graphs. You’ll fix them in the next step.
Using smart thermostats and schedules to smooth peaks and lower runtime
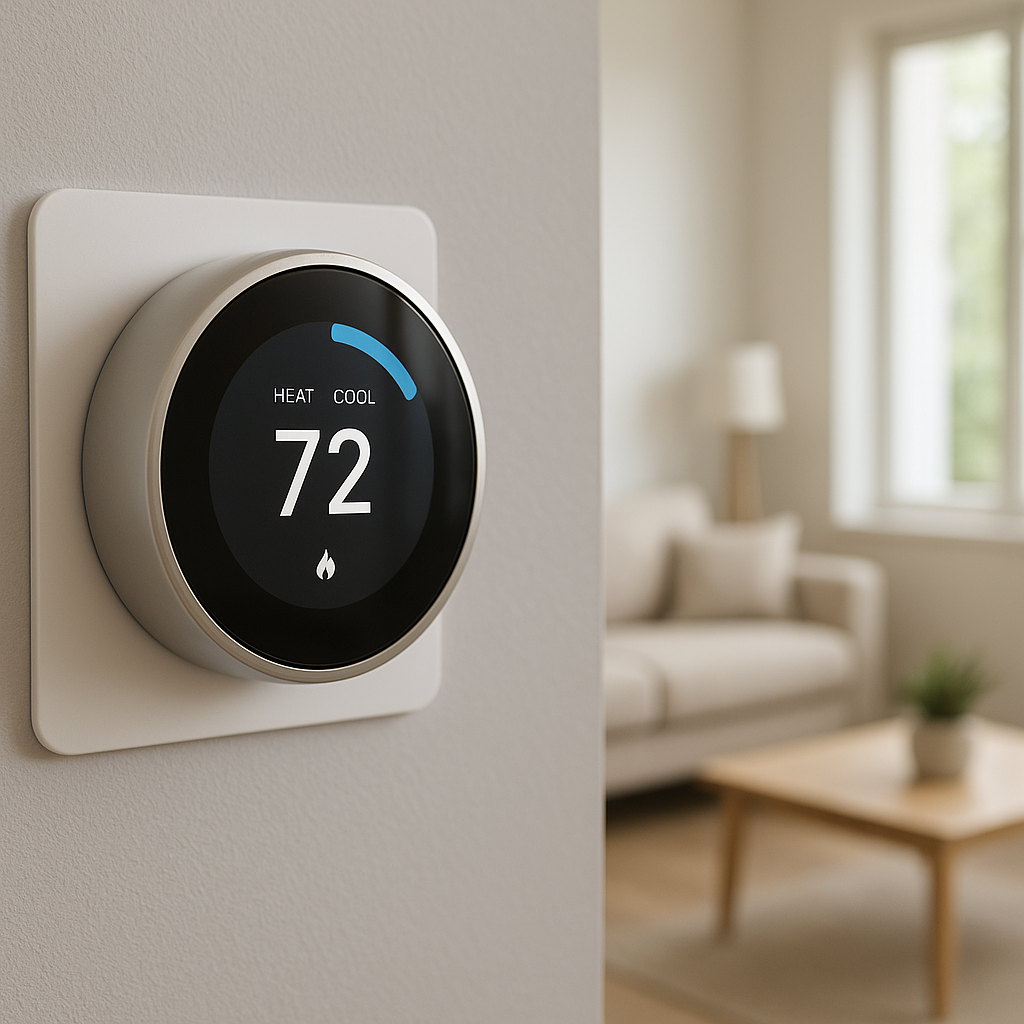
A smart thermostat (like Ecobee, Nest, or Honeywell T9) can use your data to cut HVAC waste. Helpful tactics include:
- Setting reasonable setpoints (for example, 68–70°F heating, 75–78°F cooling, adjusted for comfort).
- Creating home/away schedules so the system relaxes when nobody is home.
- Using pre‑conditioning to cool or heat just before peak rate periods.
- Enabling eco or energy‑saving modes when available.
The U.S. Department of Energy has helpful guidance on programmable thermostat strategies: programmable thermostat tips. Adjust your settings, then check your monitor over several days to confirm that peaks are smoother and total runtime drops.
Easy Win #3 (Days 7–14): Optimize Hot Water and Laundry Usage
Recognizing water heater signatures in your energy graph
If you have an electric water heater, it’s often a major load. In your graph, it may appear as:
- A thick block of 3–5 kW for 15–60 minutes.
- Several such blocks clustered around morning showers and evening dishwashing.
Mark those periods and estimate daily kWh used by the water heater from your app’s device or circuit view (if available). That tells you how valuable any changes will be.
Shifting laundry and dishwashing to off-peak times using your data
Most washers, dryers, and dishwashers now have delay start features. Use your monitor to:
- See how much power your dryer and dishwasher use per cycle.
- Note your utility’s peak vs off‑peak times in the app.
- Schedule heavy loads (towels, bedding, dishwasher) into cheaper off‑peak hours.
Track one week of “as usual” laundry, then one week of off‑peak scheduling. Your app should show lower costs even if kWh is similar.
Simple settings tweaks: eco modes, temperature, and load size
Small setting changes can cut hot‑water and laundry costs:
- Lower water heater temperature to a safe but efficient level (commonly around 120°F; confirm local guidance).
- Use eco modes on dishwashers and washers where available.
- Run full loads instead of many small ones.
- Use cold water settings for most laundry.
After adjusting, compare your water heater and laundry usage week‑over‑week to verify real savings.
Easy Win #4 (Days 10–20): Fix Lighting and Plug Load Habits
How to see the impact of lighting scenes and schedules in your data
Modern LED lighting is efficient, but in a large home with many fixtures, it still adds up. To see the effect:
- Turn on a whole lighting scene (for example, “Movie Night”) and see how many watts your power jumps.
- Do the same with all main-floor lights on vs off.
- Repeat at night to see how much lighting contributes to your baseline.
Your goal isn’t to sit in the dark, but to understand which scenes or habits are surprisingly costly.
Using smart bulbs and smart plugs to automate lights and small appliances
Simple automations can erase a lot of “oops, I left that on” moments:
- Use smart bulbs (Philips Hue, LIFX, Nanoleaf) with schedules for porch, hallway, and living room lights.
- Add smart plugs to lamps, fans, and small appliances used on a schedule.
- Group related lighting into rooms and scenes in your smart home app so you can turn them off with one tap or voice command.
Check your daily usage before and after setting up these automations. You should see shorter periods of moderate lighting usage instead of long stretches.
Creating “away” and “sleep” automations to avoid lights left on
Two key routines to create in your smart home platform:
- “Away” routine: When everyone leaves (based on phone location or a manual trigger), turn off selected lights, plugs, and entertainment devices.
- “Sleep” routine: At bedtime, dim or turn off lights, shut down TVs and game consoles, and reduce plug loads.
Watch your overnight and workday usage over a week. These routines should visibly reduce wasted kWh.
Easy Win #5 (Days 15–30): Target the One or Two Biggest Energy Hogs
Using the “top devices” or “top circuits” view to rank your energy hogs
By the second half of the month, you have enough data to identify your biggest users. Open your app’s “top devices” or “top circuits” section and list:
- The top 3–5 loads by kWh for the past 30 days.
- Whether each is essential (fridge) or optional (old beer fridge in the garage).
Focus on the one or two devices that combine high kWh with flexible usage or easy replacement.
Deciding whether to replace, repair, or reconfigure big appliances
For each major energy hog, consider:
- Reconfigure: Adjust temperatures (fridge, freezer, HVAC), reduce run times (pool pumps), or change modes.
- Repair: If a device runs constantly or behaves erratically, it may need maintenance.
- Replace: Old fridges, dryers, or window AC units can use far more energy than modern efficient models.
Your monitor helps you calculate the annual kWh of a device, which you can compare to specifications for newer models.
When your data suggests it’s time to upgrade to more efficient devices
Signs that an upgrade might make financial sense:
- A single appliance consumes a double‑digit percentage of your total monthly kWh.
- The device is old (for example, a 20‑year‑old fridge) and runs almost constantly.
- You can see from the data that it cycles poorly or never reaches stable operation.
Use your monitor’s annual usage estimate (if available) or multiply monthly kWh by 12. Compare that to the EnergyGuide label or documentation of a modern equivalent to estimate potential savings.
Building a 30-Day Action Plan From Your Smart Energy Monitor Insights
A sample 30-day checklist using real data from your home
Here’s a simple structure you can customize based on what your data shows:
- Days 1–3: Verify installation, set tariffs, and explore daily/hourly views.
- Days 3–7: Measure overnight baseline and cut vampire loads with smart plugs and strips.
- Days 7–10: Analyze HVAC patterns and adjust thermostat schedules.
- Days 10–14: Identify water heater and laundry usage; shift to off‑peak and enable eco modes.
- Days 14–20: Tune lighting scenes and plug loads; create “away” and “sleep” routines.
- Days 20–30: Use “top devices” views to target 1–2 big energy hogs for reconfiguration or replacement.
Setting realistic kWh and cost reduction goals in your app
Instead of guessing, use your first week as a starting point:
- Calculate your average daily kWh during week 1.
- Set a 5–15% reduction goal for weeks 3–4.
- Translate that into estimated monthly savings in your currency.
Many apps let you set consumption or cost targets. Use those features so you get notified if you’re drifting above your intended usage.
Tracking your progress and celebrating quick wins with the household
Energy savings work best when everyone’s on board:
- Share weekly screenshots showing reduced kWh with your family or housemates.
- Pick a small reward (a meal out, a movie night) funded by the first month’s savings.
- Assign “energy champions” for simple tasks like checking the app or running the bedtime routine.
Your monitor gives you visible proof that small changes are working, which makes it easier to keep good habits.
Advanced Tips: Alerts, Automations, and Integrations
Setting high-usage alerts and unusual-activity notifications
Alerts turn your monitor into an early‑warning system. Useful examples include:
- Whole‑home high usage alerts when power exceeds a certain kW threshold.
- Unusual activity alerts if usage stays high during times it’s usually low.
- Device‑specific alerts if a fridge, sump pump, or other critical device stops drawing power unexpectedly.
Configure alerts to avoid constant notifications; aim for signals you’ll act on, not noise.
Connecting your monitor to smart plugs, thermostats, and scenes
If your monitor integrates with platforms like Alexa, Google Home, Apple Home, SmartThings, or Home Assistant, you can:
- Trigger smart plugs to turn off if whole‑home usage goes above a limit.
- Adjust thermostat setpoints automatically during peak rate periods.
- Activate low‑energy scenes when everyone leaves or at bedtime.
Check your monitor’s documentation for supported integrations and start with one or two simple automations.
Using schedules and rules to automatically enforce the habits you want
Once you know which behaviors save energy, lock them in with rules:
- Schedules for water heaters, pool pumps, or EV chargers to avoid peak prices.
- Rules that shut down entertainment areas after a certain hour.
- Vacation modes that minimize usage when you’re away for several days.
Your monitor then becomes a way to verify that these rules are working as expected.
Common Problems When Using Smart Energy Monitor Data (and How to Fix Them)
Data gaps or missing days: troubleshooting connectivity issues
If you see blank periods in your graphs:
- Check the monitor’s Wi‑Fi or hub connection status.
- Move your router or add a Wi‑Fi extender closer to the panel if signal is weak.
- Verify your app is updated and the monitor has power.
- Reboot the monitor using its recommended procedure.
For long gaps, you may need to briefly power‑cycle the monitor or contact support. Fix connectivity issues early so your 30‑day picture is complete.
Inaccurate appliance detection and how to improve it
Automatic device detection can mislabel or merge devices. To improve:
- Help your app by naming and confirming detected devices when prompted.
- Use dedicated smart plugs on specific loads you care about for precise readings.
- Combine your observations (“the oven was on then”) with what the app thinks it saw.
Don’t worry if detection is imperfect. Whole‑home trends are still extremely useful for finding and fixing waste.
What to do if usage is still high after basic optimizations
If you’ve cleaned up the obvious issues and bills are still high:
- Compare your usage to similar homes in your region if your app or utility offers that feature.
- Review your top devices again — did you miss a big one like an old freezer or dehumidifier?
- Check if rate increases, not just usage, are driving your higher bills.
At this point, it may be time to look at deeper efficiency upgrades or get professional advice.
When to Consider Professional Help or Electrical Upgrades
Warning signs in your data that may point to wiring or equipment issues
Your monitor can sometimes hint at problems that go beyond normal waste. Warning signs include:
- Unusual, random spikes with no obvious cause.
- Devices drawing far more power than their nameplate ratings.
- Persistent high usage on a circuit even when you believe everything is off.
If you see anything that looks like a safety concern, contact a qualified electrician promptly.
How to use your energy data when talking to an electrician or HVAC pro
Your data can make professional visits more productive:
- Export or screenshot graphs showing the odd behavior and note dates and times.
- Highlight specific circuits or devices you’re worried about.
- Share week‑over‑week patterns, especially for HVAC performance.
This helps pros diagnose issues faster and recommend fixes that actually address the root causes.
Using long-term data to justify panel upgrades, insulation, or solar
Over several months your monitor becomes a record of how your home performs. You can use this history to:
- Show persistent high loads that may justify panel or wiring upgrades.
- Quantify how much of your bill is due to heating and cooling, strengthening the case for insulation or air‑sealing projects.
- Estimate how much solar capacity you’d need to offset a portion of your usage.
Your smart energy monitor data becomes a planning tool, not just a monitoring gadget.
Summary: Turn Your Smart Energy Monitor Into a Monthly Savings Habit
Recap of the 5 easy wins from your first 30 days
In your first month, you can accomplish a lot by focusing on:
- Win 1: Lowering your overnight baseline by eliminating vampire loads.
- Win 2: Smoothing HVAC spikes with better thermostat schedules and setpoints.
- Win 3: Optimizing hot water and laundry timing and settings.
- Win 4: Automating lighting and plug loads with simple routines.
- Win 5: Targeting and taming your top one or two energy hogs.
How often to review your data going forward
You don’t need to stare at graphs daily forever. A practical rhythm is:
- Weekly: Quick check of daily usage and any unusual spikes.
- Monthly: Compare this month to last month and the same month last year.
- Seasonally: Review HVAC patterns as weather changes and adjust schedules.
Turning insights into permanent, automated savings
The real power of your smart energy monitor comes when you use it to create lasting changes:
- Turn one‑time fixes into schedules and automations.
- Let alerts nudge you when usage drifts up again.
- Use ongoing data to guide upgrades and smart home purchases.
Over time, those first 30 days become the starting point for a more efficient, comfortable, and predictable home energy routine.
FAQ
Do I need a whole-home monitor, or are smart plugs enough?
Smart plugs are great for understanding and controlling specific devices, but they don’t show the full picture. A whole‑home monitor lets you see total usage, always‑on loads, and big appliances that can’t easily be put on plugs. Ideally, use both: a whole‑home monitor for trends and a few smart plugs for the devices you care about most.
How long before I see real savings from my smart energy monitor?
Many households see measurable reductions in the first month, especially after tackling vampire loads and HVAC schedules. The exact amount depends on your starting point, but savings of 5–15% on electricity use over a few months are common when you act on the data consistently.
Will my smart energy monitor lower my bill automatically?
The monitor itself doesn’t reduce usage; it gives you the information you need to make changes. When combined with smart plugs, thermostats, and automations, it becomes part of a system that can automatically enforce energy‑saving habits.
Is it safe to install a smart energy monitor myself?
Some plug‑in or clamp‑on monitors are designed for DIY installation without opening the main panel. Panel‑mounted monitors that connect to your mains should only be installed by a qualified electrician. Always follow the manufacturer’s instructions and local electrical codes.
What if my utility already provides a smart meter app?
A utility smart meter app is a great starting point and may be enough for some homes. Dedicated smart energy monitors often offer more detailed real‑time data, better device detection, and richer integrations with smart home platforms. You can use both together: the utility app to confirm billing and the monitor to guide day‑to‑day decisions.